Product management
Step-by-step instruction on creating a Customer Journey Map

An owner’s target of developing a mobile app or a WEB service is to make it an irreplaceable and beloved tool for people. Unfortunately, it’s not that easy as it may seem. Modern UI design, functionality and speed are not enough to achieve that and missing some small details can result in a fail of good promising ideas.

What you should be focused on?

To be liked by people, an app should correspond to their needs and solve their issues. It’s impossible to create users’ needs - you need to know for sure what they are worried about. If we are talking about an existing product, you need to know what users don’t like about it and what they consider as a barrier or an obstacle in the way of solving their issues. One of the solutions to learn it is to use the methodology of Customer Journey Map (CJM).

Manufactura develops digital products - mobile apps and WEB services. This article about Customer Journey Map points out these directions. But meanwhile this methodology can be applied widely - you can make sure about that on the example of such companies as Lego, Starbucks and Lancome.

PART 1. THEORY. WHAT IS a CUSTOMER JOURNEY MAP?

Customer Journey Map — is a methodology that helps to understand the route a user goes by while interacting with your product: what he likes, what irritates him and what can help him. CJM can help to create new ideas for product development and increase the user satisfaction level by multiple times. In case of launching a new product, by using CJM you will be able to predict problem areas and prepare in advance not to be mistaken.

In short, Customer Journey Map — is visualization of user interaction with a product (a mobile app, WEB service or a brand). It’s a map where touch points, barriers and people’s emotions are marked.

SIMPLE EXAMPLE of CUSTOMER JOURNEY MAP for buying a mobile phone

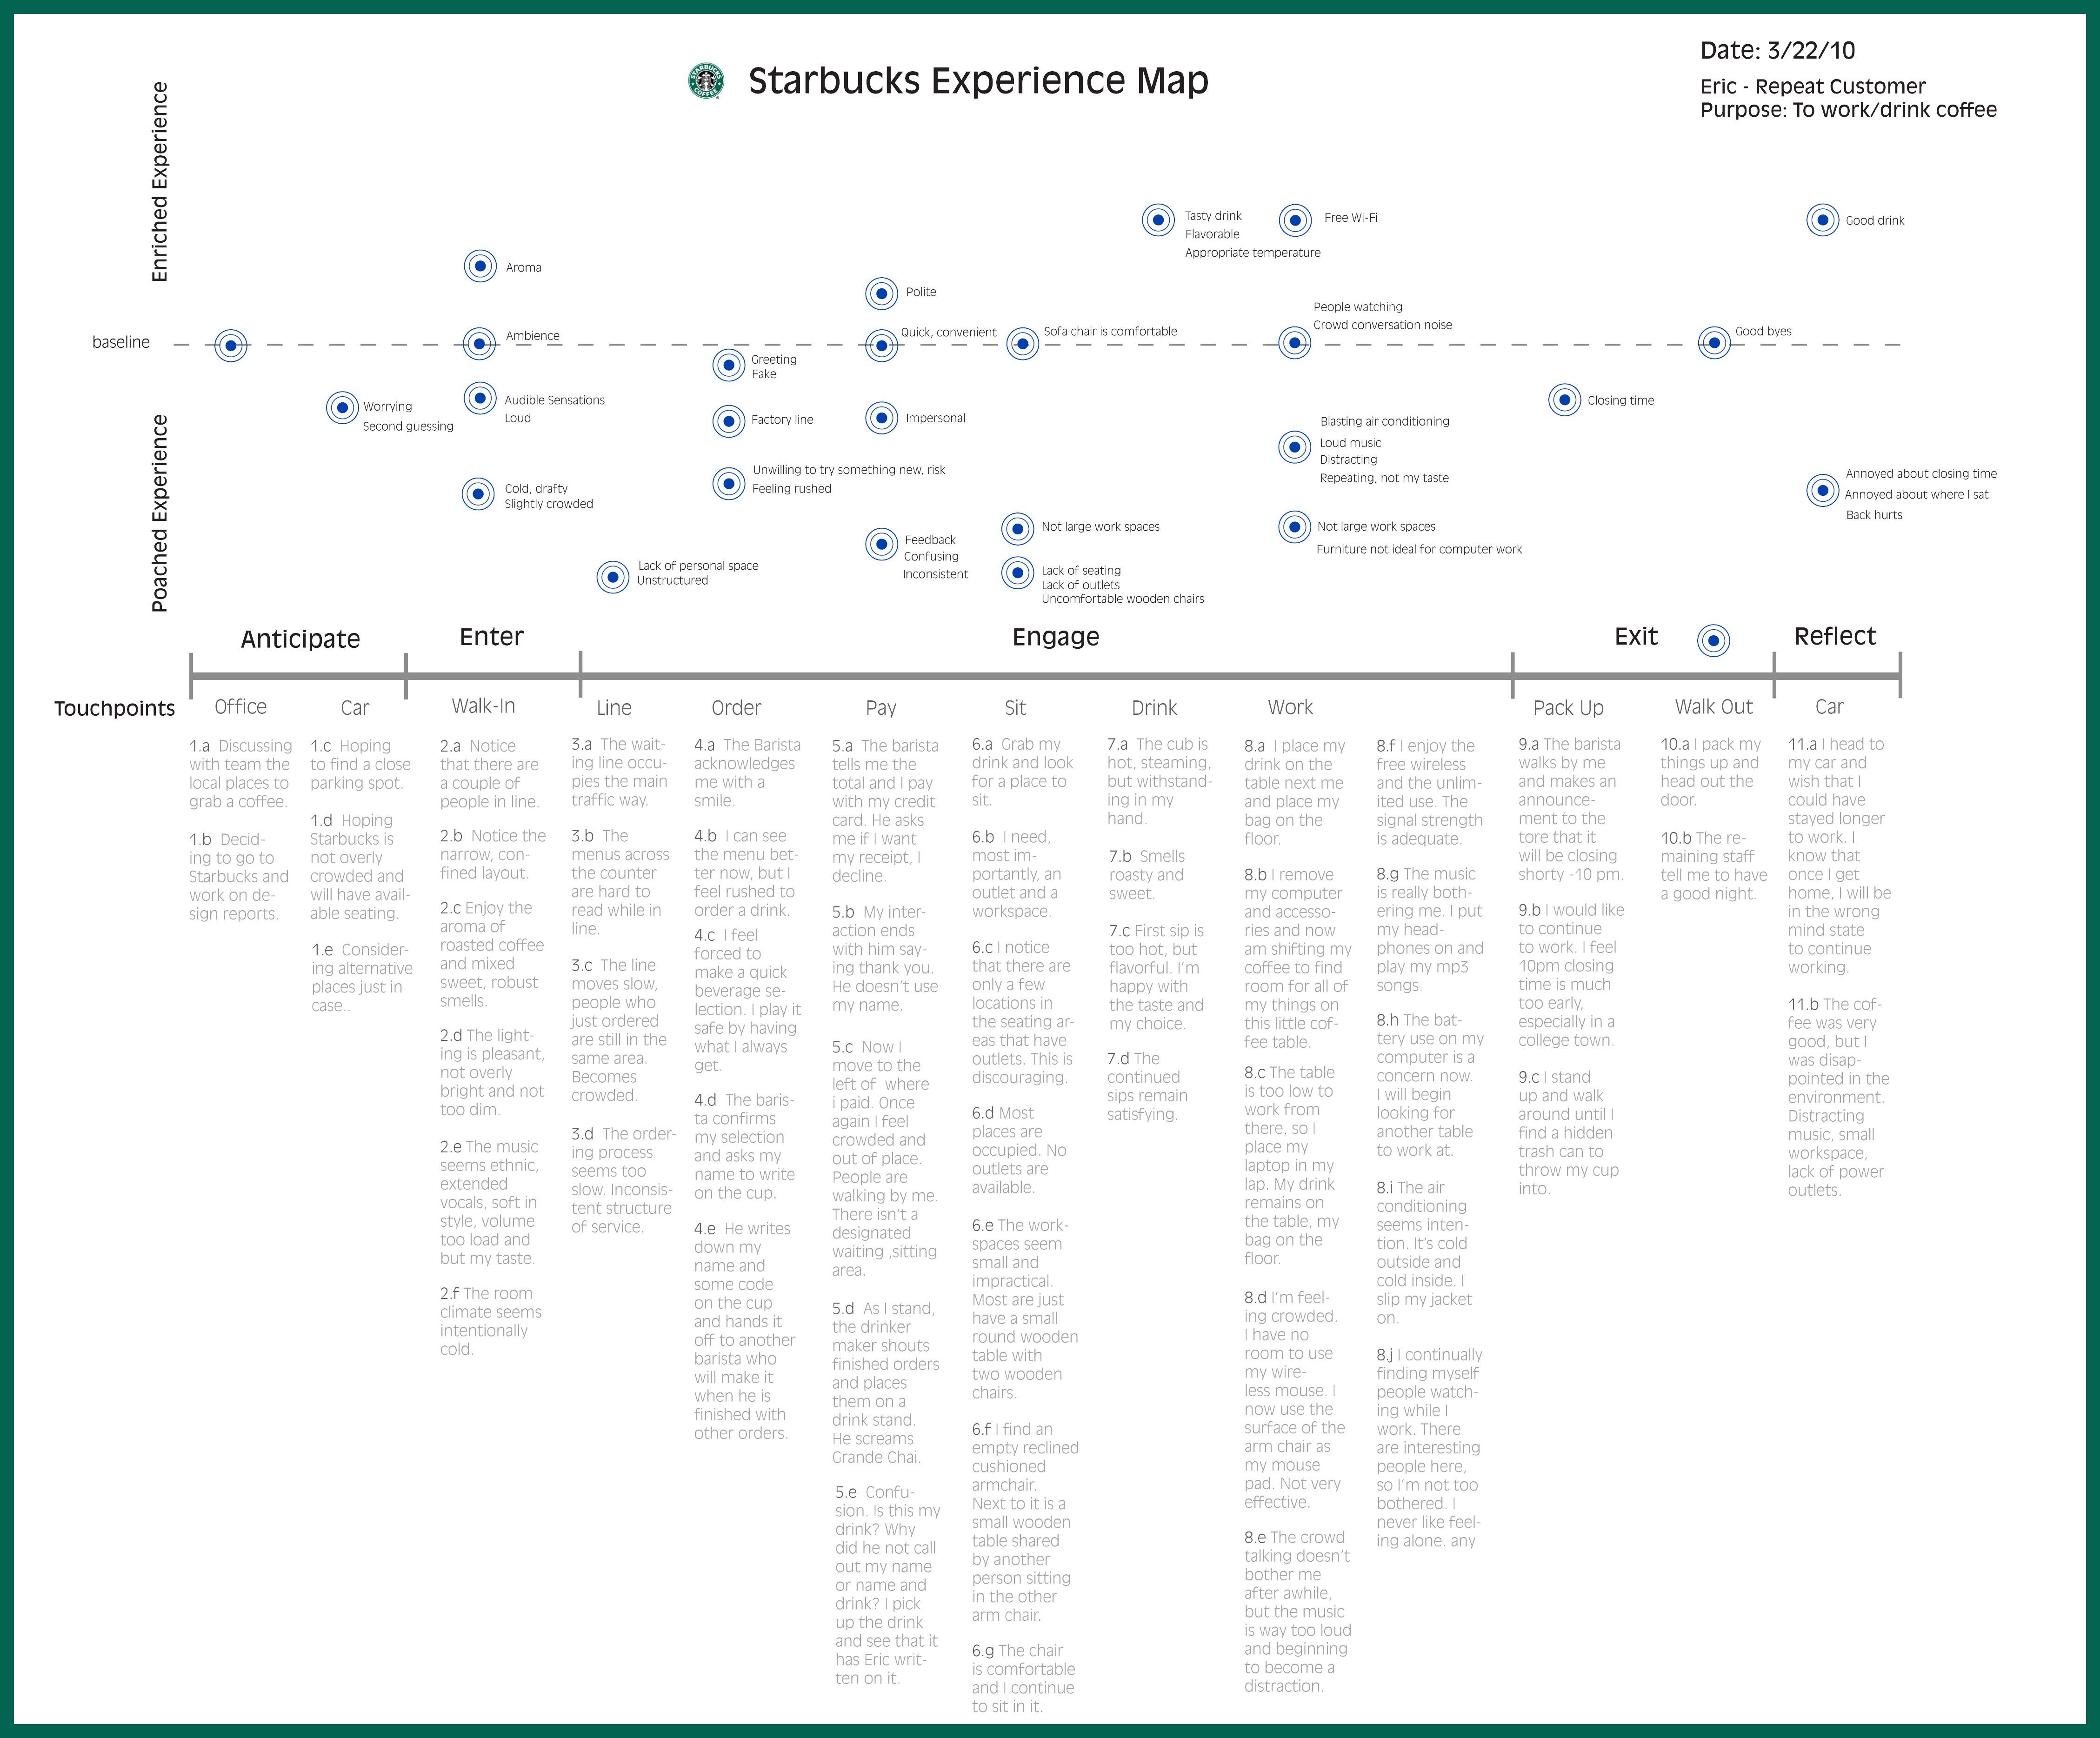
Imagine a situation.

  1. Awareness. A person needs a new smartphone. An old one is broken.
  2. Research. He surfs the Internet and try to find a suitable model. He knows the brand he likes and reads about new models, research the closest competitors and study the reviews. Then he study different retailers and compare the prices.
  3. Purchase. After the research he finally buys a smartphone.
  4. Usage. A buyer inserts a SIM-card and starts using a device. Some time later a problem occures - a Wi-Fi connection is lost.
  5. Support. A person contacts a customer service with this problem. There’s a possibility he writes about his problem on social media with a brand name to get a feedback faster.
  6. Word of mouth. If a user is satisfied with his “journey”, he tells his friends about a brand and a product and recommends them. If he is not, he will dissuade from a purchase.

All this actions, from the awareness till interaction with a brand after the purchase, are the customer journey. And the visualization of this route is a Customer Journey Map

CJM can look different for the same process. It can be done in a format of a table or a scheme. But they serve the same purpose: to describe users’ intentions, targets, emotions and actions on each step of the interaction.

WHAT WE LEARN WITH A HELP OF CUSTOMER JOURNEY MAP?

CJM methodology helps to find out the following:

  • the way different audience sections interacts with the product;
  • points of interaction with your audience (a WEB interface, a mobile application, an e-mail message, a push-notification, an office or a brochure);
  • кwhat steps users take on the way to their targets;
  • what they feel on each step;
  • where a-ha moments take place (points of the highest satisfaction from the product;
  • where people meet the barriers that keep them from reaching their targets;
  • how safely users go from one step to another.

It’s important to point that Customer Journey Map is a basis for generating new ideas that will improve user interaction experience with your product.

WHOM A CUSTOMER JOURNEY MAP CAN HELP?

CJM can be used by different kinds of companies - by those which use apps like an additional revenue source as well as app-based companies which regards digital products as their basis.

Also, this method can help at different stages of product existence:

1. PROJECT START

You have decided to make a new product. There’s a strong idea, but the level uncertainty is high and you worry about the low level of investment recovery. You want to consider possible problems and reduce risks.

2. SOMETHING GOES WRONG WITH AN EXISTING PRODUCT

Users outflow from the app is overlaps the inflow of new users. You know the reason for that, but you don’t have any ideas how to fix it. The product receives a lot of negative reviews, but you are not sure that the “shouting” minority draw your attention to the real problems.

3. A SUCCESSFUL PRODUCT STOPPED DEVELOPING

There’s nothing left to develop in the product and it reached the “glass ceiling”. Now an idea is needed to strengthen the connection with an old audience and attract new users as well as point to the further development route.

WHERE TO GET DATA TO BUILD CUSTOMER JOURNEY MAP?

Existing product New product
Implementation of the analytics systems.

For mobile products: Appmetrika, Localytics, Amplitude, Firebase, Flurry, Fabric, CleverTap, Adjust, Branch.io and others.

For WEB-products: Google Analytics, Yandex.Metrika, Roistat.
  1. Competitors analysis.
  2. Open Source study, social surveys study, search queries study in the services like Google Trends, WordStat, Statista.
  3. Consulting the experts.
  4. Target audience interview.
  5. Conducting marketing experiments.
  6. Forecast building based on the theoretical models. For example, we can use a well-known Pareto principle. According to it, for a digital product, 80% of the audience will be using only 20% of the features.

One more important variant for getting the the data regarding a new product is launching of an MVP (minimum viable product). For MVP it can be enough to take about 20% of the planned features and invest only 60% of the budget for launching it.

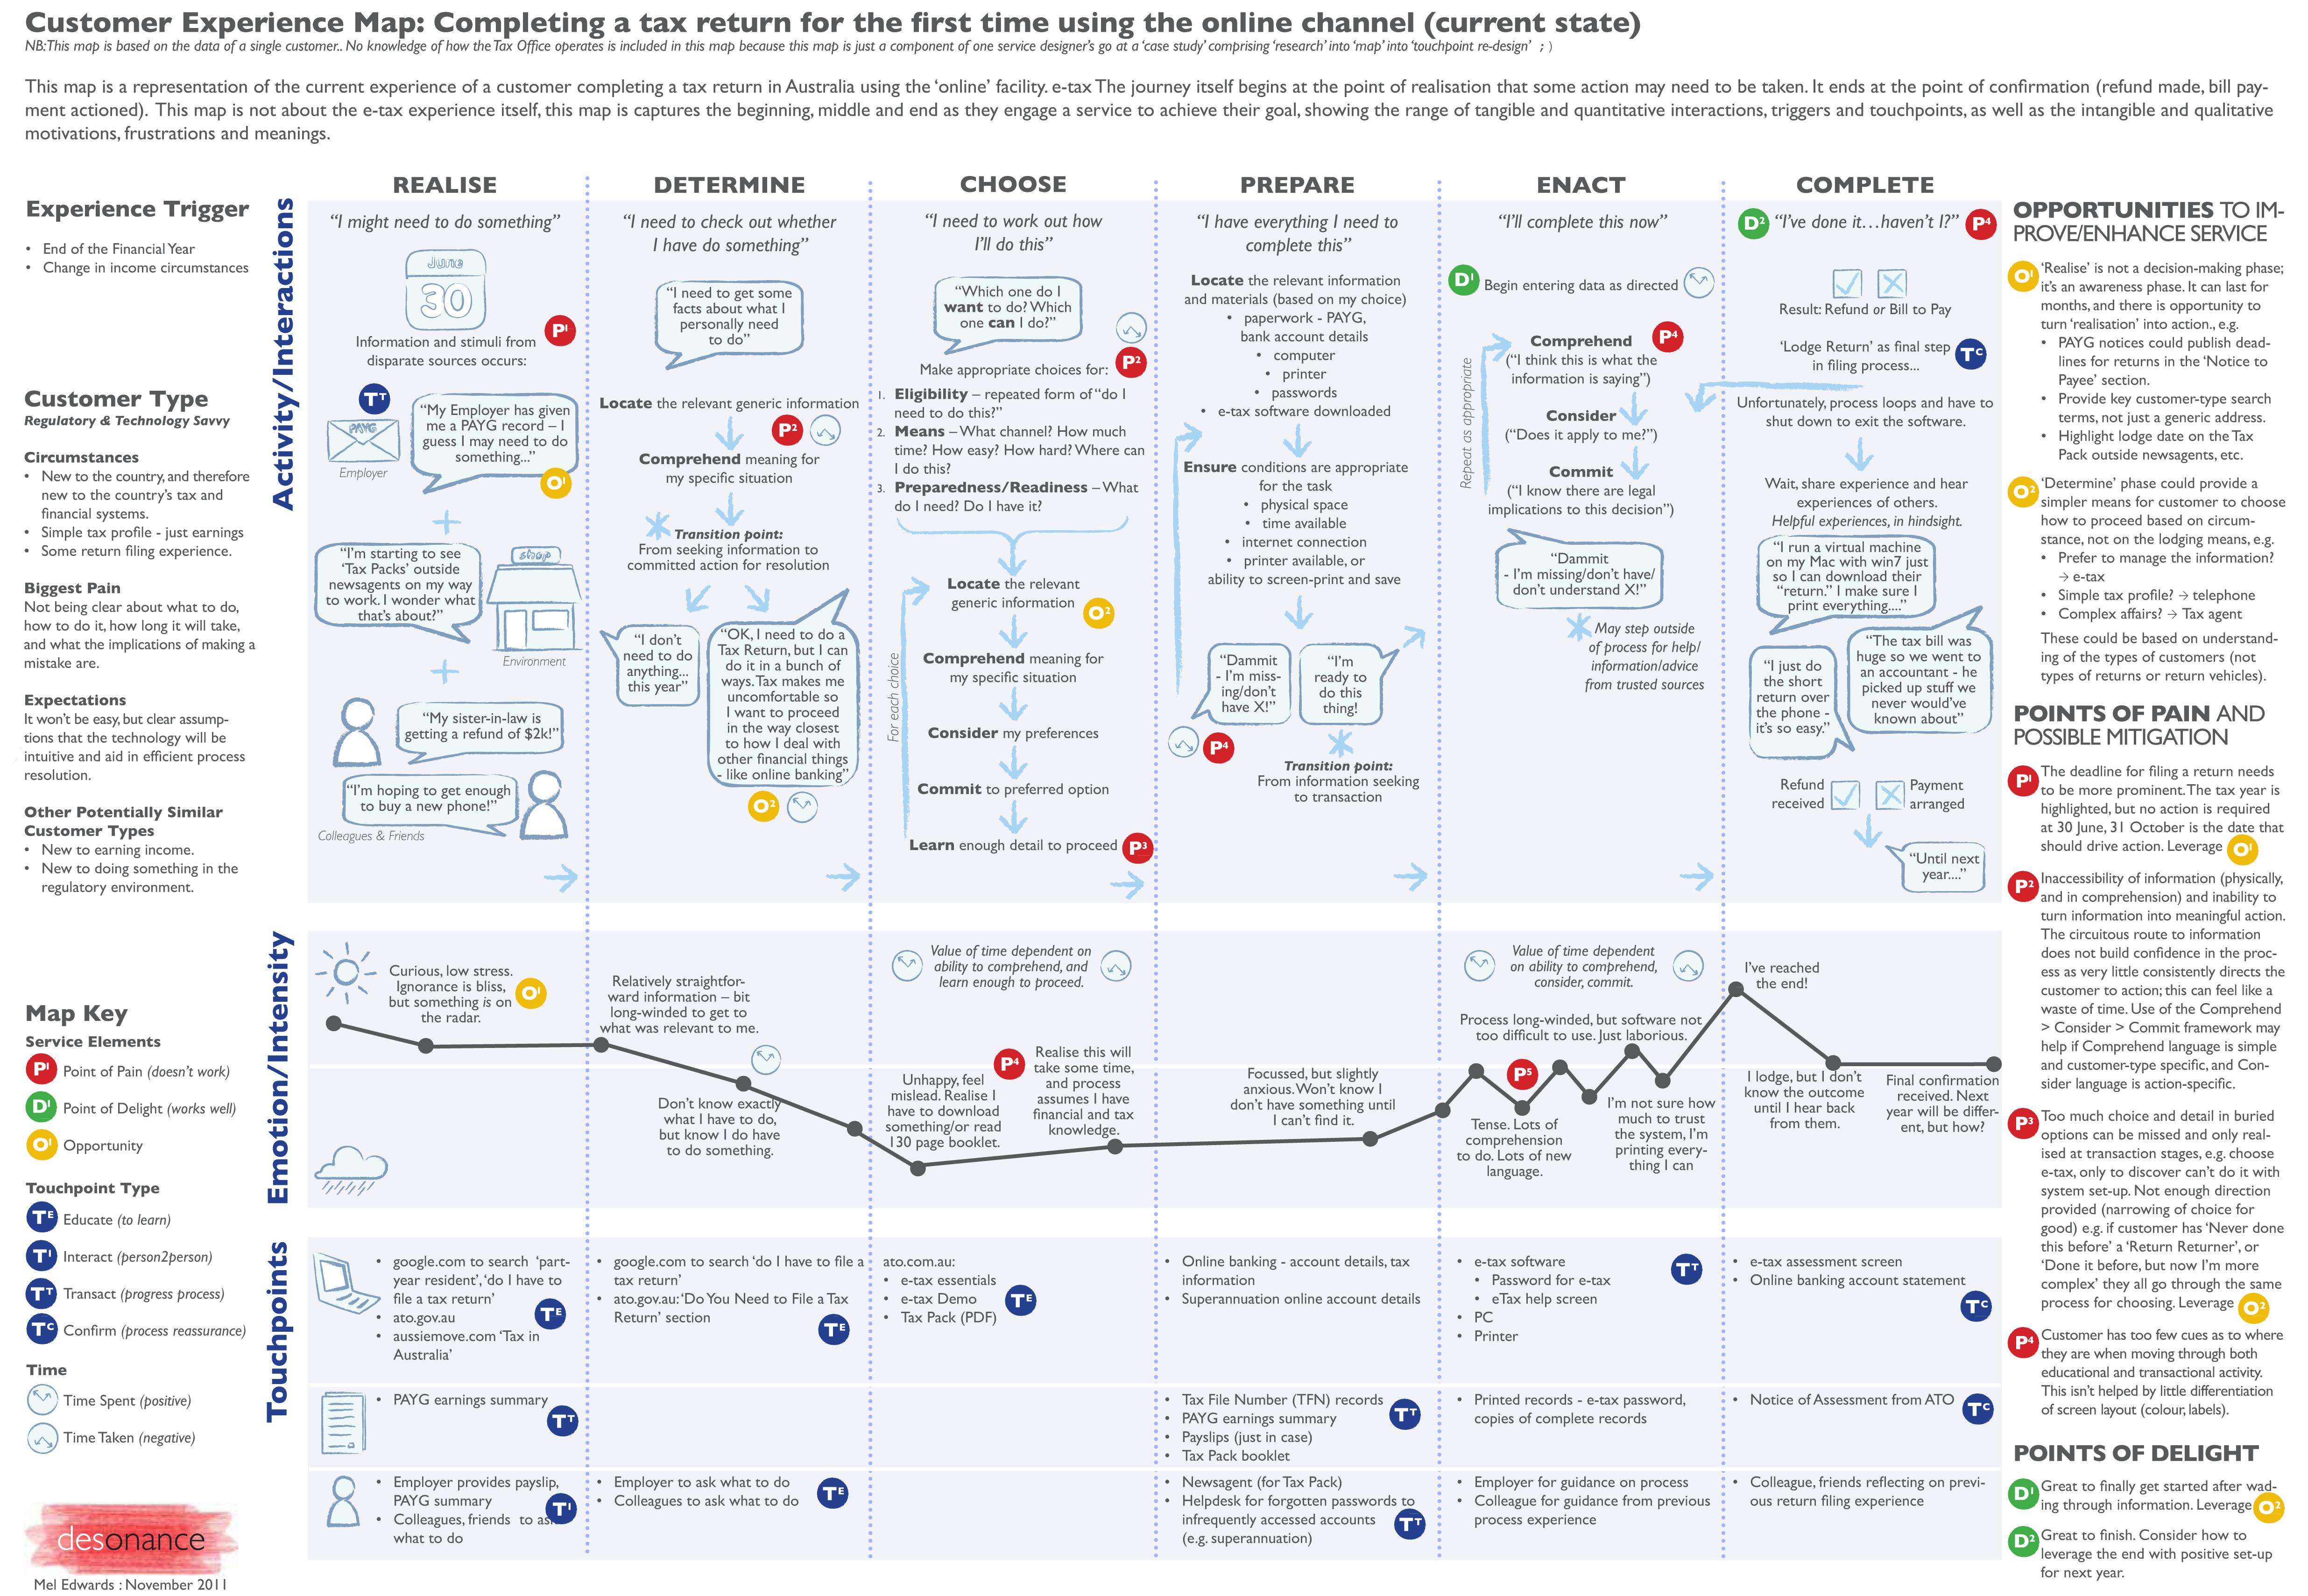
Details for LANCOME PARIS case

Here is the customer interaction map with Lancome brand:

In the blue circles you can see the sequence of the user actions: a need acknowledgement, reading recommendations, exploring of the offers, discussion with friends,ordering and payment, delivery expectation, receiving the products and their review.

A pink line with colorful stars shows an emotional state of a user: at the moment of a need acknowledgement - excited, while searching - worried, after a talk with friends - partially satisfied.

In the lower cells, there are questions that worry a customer on each step and thing that can satisfy him/her at a maximum level on each step. For example,at the step of a need acknowledgement, customers ask themselves a question: «What do I need to buy? Is it ok with my skin type?» and they need a trustworthy information about it.

When they choose the product, they are interested not only in prices, but also in shipping terms, they study the information about the brand, sometimes they need free samples, fast customer service and an easy way to return the product.

In this case a product is the whole brand, and the CJM describes all the step of a customer interaction with it, including non-digital. To create it, several researches were performed - customer surveys, statistics study and etc.

If a product is a digital one, the methods of research will be also uneasy, and the whole process will require a serious preparation.

Part 2. PRACTICE. HOW TO TAKE A USER'S WAY TOGETHER WITH IT?

Manufactura company identifies 5 steps that help to create a Customer Journey Map.

We will show the application of Customer Journey Map using the example of a case study on the development of the mobile app Meinestadt for a German company.

PROJECT SUMMARY

  • Customer: Meinestadt is a hyper-local media, containing information about events, objects, dating, rental property in German cities. The mobile application has been installed 1 million times..
  • Object: to achieve KPI in terms of user satisfaction and revenue growth.
  • Development terms: 12 months.
  • Process: MVP and 6 updates were released in 12 months. The revenues of the application were equal to the development costs during the 9th month.
  • What was achieved with the help of CJM: The application's revenue was 138% higher than the planned KPI specified at the start of the project. The average monthly app rating in the App Store and Google Play has grown from 2 stars to 4,67.

Step 1. AUDIENCE SEGMENTATION

Even the most simple mobile application cannot have a completely homogeneous audience. Therefore, in the first step, we propose to use a classic marketing technique - segmentation.

We set triggers to the application that fix the sequence of peoples’ actions, and then we determined which scenarios were repeated most often. This helped to distinguish three main groups:

  • Reader. Examines the feed looking for interesting news. This role is assumed by 69% of the audience.
  • Navigator. Looking for objects - restaurants, cafes, bars, gas stations. 58% of the audience.
  • Networker. Looks for interesting events via the app - concerts, sports events, exhibitions, and buys tickets. 50% of the audience.

There were no Authors in this list - an audience segment in which our client believed most. Analytics showed that users who would like to create content themselves (write notes, upload photos) are only 0.01% of the audience, which is very little. ☝️ Denial of the erroneous hypothesis saved the client from investing in unclaimed functionality.

Step 2. SEARCH FOR AHA-MOMENTS

When a user finds what he needs, he says «aha, this is it!» and feels a strong positive emotion. This is the ‘aha’ moment, the point of satisfaction of a need, to which a person will return again and again.

Overlaying retention graphs
From Yandex.Appmetrika

Retention rate is an important guideline in finding ‘aha’ moments. While Investigating the Meinestadt audience, we saw that people, who used the search to find a location of interest, returned to the application more often than those, who simply examined the list of proposed locations. So the idea was born to make the search more accessible and understandable.

We compared the Retention rate of users, who performed different actions, and looked for ‘aha’ moment for each audience segment. Here is what we have found:

  • Reader immediately after the ‘aha’ moment - shares the news in social networks;
  • Navigator — paves a route.
  • Networker — adds to the calendar, buys a ticket.

Definition of ‘aha’ moments helped to establish itself in the selected segments of the audience and understand what functionality is in most demand.


Step 4. CUSTOMER JOURNEY MAP PROJECTING

Now it’s time to unite all the data on one map and it can be done as a spreadsheet with the following details:

  • a list of steps a user performs;
  • success criteria: what can be considered as a successful user action;
  • retention rate when a user reaches each step;
  • conversion rate for each transfer from one step to another;
  • point of contact - a mobile app, a web-site, an e-mail message, a push-notification;
  • audience size at each step;
  • emotional state description («It seems I’m confused», «Maybe I should give up?», «I’m close to the target», «That’s what I need!», also the emotional state can be described with emoji);
  • critical level of the point;
  • barriers;
  • ways to decrease the barriers for different points of interactions: these are our points for development.


Download the template for Customer Journey Map for your project


ABOUT BARRIERS AND WAYS TO OVERCOME THEM

If the percentage of the conversion from one step to the next one is low, there’s a barrier on the user’s way. There’s a possibility that a user hasn’t found an icon needed, or an authorization is required for some meaningless action, or a user has found an external link and left your product.

In the Meinestadt.de App before the creation of Customer Journey Map, there was a feature for UGC (user generated content). But the most part of the audience didn’t want to generate anything - people were interested in the search feature.That’s why we relocate the UCG function (a button “Post news”) from the spotlight and put the search bar on the main screen.

In other project on the KPI development - Pikabu - for struggling the barriers we allow users to make some basic actions without an authorization as well as, for example, show the hottest comment for a post to simplify the access for an interesting discussion.

Step 5. RANKING OF IDEAS AND DEFINING MVP

The ways of decreasing barriers that were found at the previous step are a guide to action for a developer. Now he/she knows what needs to be developed in the near future.

But the list of barriers and methods for their elimination can be very long, so it is very important to determine their priority in order to implement the most popular features first.

Priority can also be determined not approximately, but by using certain methods. Manufactura team, when working with Customer Journey Map, uses for calculations a formula where the following indicators are added: a degree of criticality of the point, a simplicity level of implementation of the design, a simplicity level of the development and the percentage of the affected audience.

As a result we get a finished feature list, ranked by priority. The highest positions in it are occupied by tasks that, on the one hand, have the maximum impact on the audience and at the same time require a minimum of resources.

Also, It is extremely useful to determine what functionality is needed for your MVP in the simple way, if you haven’t started development yet.